RETENTION · B2B AGENCIES
Net Revenue Retention for Agencies: Formula + Example
Net revenue retention for agencies: the NRR formula, a worked example with numbers, how NRR differs from GRR and logo churn, and how to read the result.
Quick question. If your agency signed zero new clients next year, would your revenue go up or down?
Most founders guess. Net revenue retention (NRR) gives you the number. :)
NRR tells you whether the clients you already have are worth more or less a year from now. It ignores new business completely. That's the point. This guide shows the formula, a worked example with real arithmetic, how to read NRR next to gross revenue retention (GRR), and what's different when you run an agency instead of a software company. You get a copyable monthly review and an AI prompt. We built a software agency from zero to 110 people and exited, and the existing-client base was always the part we watched most closely.
I'll add a lesson that costs revenue if you ignore it. Don't try to expand an account where the relationship is weak. I tried to sell more to a client with a low NPS and no real relationship. The result was zero, and the client trusted us less. In NRR terms that kind of ask doesn't add expansion. It risks the account.
What is net revenue retention?
Net revenue retention measures how much recurring revenue you keep and grow from existing customers over a set period, usually a year. First Round's glossary explains that an NRR above 100% means upgrades, upsells and cross-sells outweigh churn, cancellations and downgrades. It adds that NRR is also called net dollar retention (First Round Review, "Net Revenue Retention", published 18 September 2025, retrieved 5 November 2026).
Plain version: take the clients you had on day one. Look at what they pay you today. Compare.
- Above 100%: your existing clients grew in total. You'd grow even with zero new sales.
- Below 100%: your existing clients shrank in total. New clients have to fill the hole before you grow.
Rule of thumb: NRR is the honest scoreboard for an agency that lives on long-term clients.
Takeaway: NRR shows what your existing base does on its own.
The NRR formula
COPY & ADAPT
NRR = (Starting revenue + Expansion - Contraction - Churn) / Starting revenue
GRR = (Starting revenue - Contraction - Churn) / Starting revenue
- Starting revenue: recurring revenue from the clients you had on day one of the period.
- Expansion: extra revenue from those same clients: more hours, new services, higher rates.
- Contraction: revenue lost from downgrades, discounts or reduced scope.
- Churn: revenue from clients who left.
New clients are excluded. A client who joined mid-period doesn't count in either number.
Takeaway: same clients at the start and the end, nothing else.
Want help putting this into practice? See how we can help
A worked example (fictional agency)
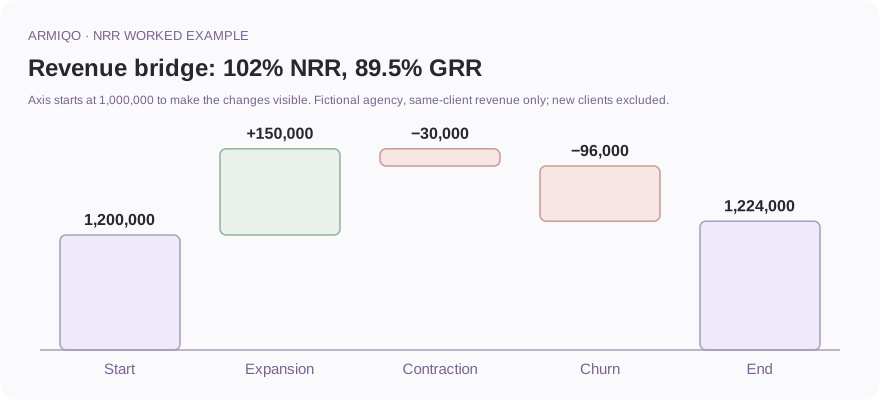
An agency starts the year with 20 retainer clients paying 1,200,000 a year in total. During the year:
- Four clients expand: +150,000.
- Three clients reduce scope or get a discount: −30,000.
- Two clients leave: −96,000.
- The agency also signs five new clients worth 200,000. They don't count.
| Line | Amount | % of starting revenue |
|---|---|---|
| Starting revenue | 1,200,000 | 100% |
| Expansion | +150,000 | 12.5% |
| Contraction | −30,000 | 2.5% |
| Churn | −96,000 | 8% |
| End revenue from the same clients | 1,224,000 | 102% |
NRR = 1,224,000 ÷ 1,200,000 = 102%. GRR = (1,200,000 − 30,000 − 96,000) ÷ 1,200,000 = 1,074,000 ÷ 1,200,000 = 89.5%.
Read together: the existing base grew by 2%. But the agency lost 10.5% of its starting revenue to churn and contraction. Expansion covered the hole. That's fine for one year. It's a risk if it becomes the plan.
You can try your own numbers in the free Net revenue retention calculator.
Takeaway: 102% looks healthy until you see 89.5% next to it.
NRR vs GRR vs logo churn
Three numbers. Three different questions.
| Metric | Question it answers | Includes expansion? | Can it exceed 100%? |
|---|---|---|---|
| NRR | Do my existing clients grow or shrink in total? | Yes | Yes |
| GRR | How much of the revenue do I keep? | No | No |
| Logo churn | How many clients did I lose? | No | No |
First Round's glossary notes that GRR ignores expansion, so it can never exceed 100%, while NRR can climb well above it. DataRails' guide (last updated 23 September 2026) adds the warning that matters most: high NRR with low GRR often means expansion revenue is masking a churn problem (First Round Review, as above; DataRails, "GRR vs NRR", retrieved 5 November 2026).
For a deeper look at logo churn and the formulas around it, see our guide on churn rate vs retention rate for agencies.
Takeaway: NRR says how big the base is. GRR says how leaky it is.
What's different when you run an agency
Most NRR guides are written for software subscriptions. Agencies need a few extra rules.
- Use recurring or retained revenue only. One-off projects don't repeat, so they distort the number.
- Decide what counts as expansion. More hours, a new service, a rate increase. Pick a rule and write it down. Stay consistent.
- Segment by client size. Your top five accounts can matter more than the other twenty combined.
- Choose a period you'll actually review. A year gives the cleanest number. A quarter gives you time to act.
- Treat discounts as contraction. If you gave a client 10% to keep them, that's contraction, even if they stayed.
Takeaway: write the rules once, then don't change them.
How to read your result
| NRR | GRR | What it often means | First move |
|---|---|---|---|
| Above 100% | High | Healthy base that also grows | Protect the top accounts |
| Above 100% | Low | Expansion is hiding a leak | Check renewal risk on the biggest accounts |
| Below 100% | High | You keep clients but don't grow them | Look for the next useful conversation |
| Below 100% | Low | The base is shrinking | Fix retention before adding sales |
"High" and "low" depend on your clients and contracts. Compare against your own history and your own segments, not a generic benchmark. That's why we don't quote one here.
Signals are probabilities, not verdicts. Use the table to pick a question, not a conclusion.
Takeaway: read the pair, not the single number.
The three levers that move NRR
Every change in NRR comes from one of three places.
- Churn. Clients who leave. Our guides to client renewal risk warning signs and reducing B2B client churn show how to catch it early.
- Contraction. Clients who stay but pay less. Check discounts, reduced scope and unused hours at renewal.
- Expansion. Clients who grow. Our guide to B2B account expansion covers how to find the next conversation, and the client health score helps you pick the right accounts.
Look at your revenue bridge. Which line is the biggest? Start there.
Takeaway: fix the biggest line first.
Client renewal risk: 7 warning signs to spot 90 days out ↗
How to reduce B2B client churn: a weekly retention routine ↗
B2B account expansion: grow agency clients without pushing an upsell ↗
A 30-minute monthly NRR review
You don't need a dashboard. You need a list and thirty minutes.
COPY & ADAPT
Client | Revenue at start | Revenue now | Change | Why | Next step
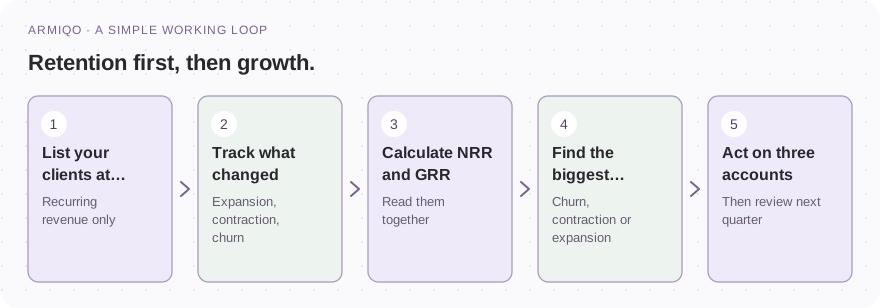
- List your top ten clients by revenue.
- Fill the columns, with one line of "why" in the client's words.
- Mark each change as expansion, contraction or churn risk.
- Pick three accounts. Give each a next step, an owner and a date.
- Recalculate NRR and GRR once a quarter.
Keep the "why" short. A sentence is enough. In six months, those sentences are your best data.
Takeaway: ten accounts, thirty minutes, three next steps.
Use AI to explain your numbers
AI is good at arithmetic and explanation, as long as you give it real numbers. It's bad at guessing the ones you forgot. Always check the maths.
COPY & ADAPT
You are a revenue analyst for a B2B agency.
Period: [quarter / year]. Starting recurring revenue from existing clients: [amount].
Expansion: [amount]. Contraction (discounts, reduced scope): [amount]. Churn: [amount].
New clients added in the period: [amount] (exclude from the calculation).
Calculate NRR and GRR and show the arithmetic. Then explain in plain English: do existing
clients grow or shrink on their own, what is the biggest driver, and what are three actions
for next quarter. List questions I should ask about my five largest accounts.
Use only my numbers. Do not quote industry benchmarks.
The free Net revenue retention calculator has the same prompt, ready to copy or download as a Markdown file.
Takeaway: AI explains the numbers, you check the maths.
Where NRR fits into B2B key account management
In B2B key account management, NRR is the scoreboard. Your account plans are the game.
Each key account should have a goal, an owner and a next conversation. NRR tells you whether those plans work across the whole base. Review it next to health scores, and link it to renewals. The account plan template is the quickest way to start, and our guide to client lifetime value for service firms shows what each point of retention is worth.
Takeaway: NRR is the scoreboard. Account plans are the game.
Account Plan Template: How to Write One in 30 Minutes ↗
Client Lifetime Value for Service Firms: Formula + Example ↗
Common mistakes
Most of these are quick to fix before you send or ask for anything.
- Counting new clients in NRR.
- Mixing one-off project revenue with retainers.
- Reading NRR without GRR.
- Changing the rules every quarter.
- Quoting a generic benchmark instead of comparing to your own history.
- Ignoring the top five accounts.
- Treating a discount as "a client we kept" instead of contraction.
Your next step
Write down your starting revenue for the year. List what changed for each of your top ten clients. Then calculate NRR and GRR.
Which line in your revenue bridge surprised you? :)
Start with one account this week
- Choose the period and the list of clients you had on day one.
- Use recurring or retained revenue only.
- Write down your rules for expansion and contraction.
- Add up expansion, contraction and churn.
- Calculate NRR and GRR, and read them together.
- Find the biggest line in the revenue bridge.
- List your top ten clients and mark each change.
- Pick three accounts with a next step, owner and date.
- Review NRR every quarter, and the top ten every month.
- Don't compare to a generic benchmark.
Common questions
How do you calculate net revenue retention?
Add expansion to starting recurring revenue, subtract contraction and churn, and divide by starting revenue. Only count the clients you had at the start of the period. New clients are excluded.
What is the difference between NRR and GRR?
Gross revenue retention ignores expansion, so it measures how much revenue you keep and can't exceed 100%. Net revenue retention includes expansion and can. Read them together.
What is a good NRR for an agency?
It depends on your clients, contract length and how much of your revenue is recurring. Above 100% means existing clients grow in total. Compare against your own history and your own segments rather than a generic benchmark.
Should one-off projects count in NRR?
For a clean number, use recurring or retained revenue only. One-off projects don't repeat, so they make the result swing. If projects are most of your revenue, track retention by client instead.
How often should I calculate NRR?
Quarterly is a good rhythm, with a monthly look at your top ten accounts. A year gives the cleanest number, but a quarter gives you time to act.