ACCOUNT MANAGEMENT · B2B AGENCIES
Churn Rate vs Retention Rate for Agencies: Formulas
Churn rate vs retention rate explained for agencies: simple formulas, a worked example, revenue churn, NRR and a monthly routine you can copy today.
Churn rate vs retention rate is one of those questions that sounds like a vocabulary quiz, until you try to report the numbers to a partner or a board. One person says "we lost 10% of clients", another says "we kept 90%", a third says "revenue is flat", and nobody is sure whether they are describing the same year. For an agency, a mix-up like this can hide a real problem, such as one large client leaving while three small ones arrive.
This guide explains the difference between churn rate and retention rate in plain English, with the formulas you need and nothing else. You will see how to calculate both by client count and by revenue, how to turn a monthly figure into an annual one, how to read net revenue retention, and how to avoid the mistakes that make the numbers look better or worse than they are. There is a worked example with a fictional agency, a table of formulas, a copyable monthly template and a short routine to keep the numbers current.
There are no industry benchmarks here on purpose. Client size, contract length and service mix vary so much between agencies that someone else's average is rarely useful. The most reliable comparison is your own history, by segment. If you would like to skip the arithmetic, the free Retention and churn rate calculator on this site does every formula in this guide.
Churn rate vs retention rate: what each one measures
Churn rate measures what you lost. It is the share of clients who stopped working with you during a period, compared with the clients you had at the start of that period. Retention rate measures what you kept. It is the share of those same starting clients who were still with you at the end. Because both numbers describe the same group of clients, they always add up to 100%. If churn is 10%, retention is 90%. If retention is 85%, churn is 15%.
So why use two names? Mostly because of the question each one answers. Churn is a problem number. It points at a leak, and it is natural to ask where the leak is and how to plug it. Retention is a health number. It tells you how much of your base you can count on, which makes it better for planning, forecasting and for telling a positive story. Neither is more correct. Pick one as your headline, show the other beside it, and keep the definition fixed so that this quarter can be compared with last quarter.
The term "client" matters too. Software companies talk about customers, subscribers and users. Agencies and consultancies usually count clients, accounts or retainers, and the numbers are much smaller. An agency with 25 clients that loses two has a churn rate of 8%. That one number moves a lot when a single client leaves, so the context behind it matters more than the percentage itself. We come back to this in the section on small numbers.
One more distinction is worth making early. Churn and retention are rates over a period. They are not the same as a renewal rate, which looks only at contracts that were due for renewal in that period. An agency with annual contracts could have a 100% renewal rate in a quarter where only three contracts came up, and still have lost clients who left mid-term. Say which one you are reporting.
The churn rate formula and retention rate formula
The formulas are short. The only trap is deciding which clients belong in the calculation, so write the rule down once and stick to it. The starting group is the clients who were active on the first day of the period. A client who joins during the period is not part of that group, so they never appear in the calculation until the next period begins.
Churn rate is clients lost during the period divided by clients at the start. Retention rate is clients at the start who are still active at the end, divided by clients at the start. An equivalent shortcut is retention rate equals one minus churn rate. Use whichever your team finds easiest to explain, but check one against the other. If they do not add up to 100%, something is being counted twice.
Notice what is missing. New clients do not appear in either formula. That is deliberate. If you count them, a strong sales quarter hides a weak retention quarter, and you stop seeing the leak. Growth and retention are separate questions, and they deserve separate numbers.
The table below puts the main formulas side by side, including the revenue versions that matter for agencies. They are standard formulas, so you can check them against any finance reference. We explain the revenue ones in a later section.
| Measure | Formula | What it answers |
|---|---|---|
| Client churn rate (logo churn) | Clients lost in the period ÷ clients at the start | What share of clients left? |
| Client retention rate | Clients at the start still active at the end ÷ clients at the start (or 1 − churn rate) | What share of clients stayed? |
| Revenue churn rate | (Revenue lost to cancellations + downgrades) ÷ revenue at the start | How much recurring income did we lose? |
| Gross revenue retention (GRR) | (Starting revenue − revenue lost to cancellations and downgrades) ÷ starting revenue | How much income stayed, ignoring any growth? |
| Net revenue retention (NRR) | (Starting revenue − revenue lost + expansion revenue) ÷ starting revenue | Did our existing clients grow or shrink overall? |
| Annualised churn | 1 − (1 − periodic churn) ^ number of periods | What does a monthly or quarterly rate mean over a year? |
| Average client lifetime | 1 ÷ annual churn rate | How long does a client stay, on average? |
Want help putting this into practice? See how we can help
A worked churn rate and retention rate example
Here is a fictional agency, so the numbers are easy to follow. It is not real client data. On 1 January, the agency has 20 clients on retainers. During the year, two of them leave, and three new clients join. On 31 December it has 21 clients.
Churn rate is 2 divided by 20, which is 10%. Retention rate is 18 divided by 20, which is 90%, or equivalently 100% minus 10%. The three new clients do not change either number. If you had used the closing figure by mistake, dividing the two lost clients by 21, you would have got 9.5% and under-reported the churn. The gap is small here, but it grows quickly when growth is fast.
Now add revenue. Suppose the 20 starting clients paid 100,000 a month in total. The two clients who left paid 12,000 between them. Another client cut its retainer by 3,000. A fourth client added a new service worth 9,000. Revenue churn is 15,000 divided by 100,000, which is 15%. Gross revenue retention is 85%. Net revenue retention is 100,000 minus 15,000 plus 9,000, divided by 100,000, which is 94%.
Read the two stories together. By client count, the agency kept 90%. By money, it kept 85% before growth and 94% after growth from existing clients. Revenue churn is higher than client churn, which tells you that the clients who left were larger than the average client. That is exactly the sort of finding you miss if you track only one view. It also suggests a useful next question: why did two of the bigger accounts leave?
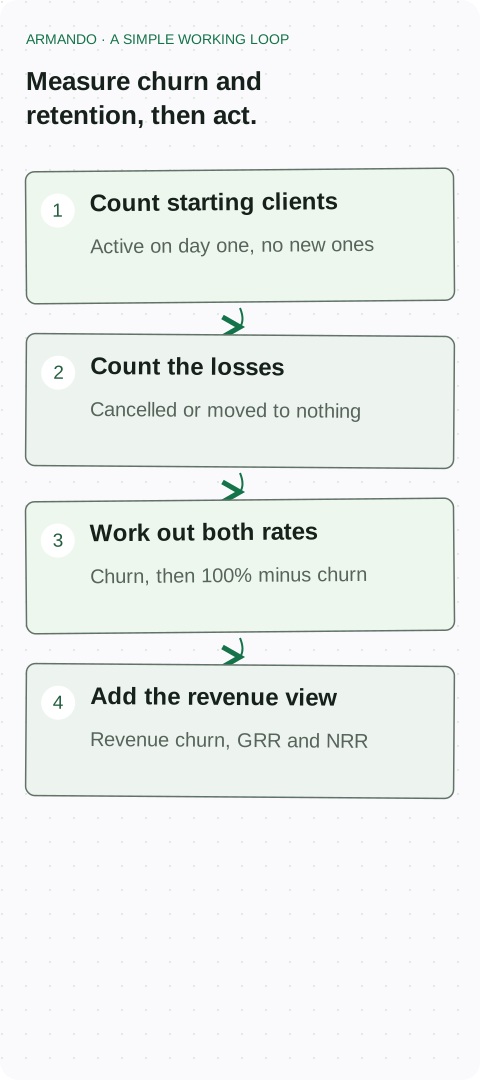
- Count the clients active on the first day of the period: 20.
- Count how many of those clients left during the period: 2.
- Divide the lost clients by the starting clients for churn: 2 ÷ 20 = 10%.
- Subtract churn from 100% for retention: 90%.
- Repeat with monthly recurring revenue to find revenue churn, GRR and NRR.
Client churn vs revenue churn and net revenue retention
Client churn, sometimes called logo churn, treats every client as equal. Revenue churn weights each client by what it pays. For an agency with a wide spread of retainer sizes, the second view is often closer to the truth about the business. Losing a client who pays 1,000 a month and losing one who pays 20,000 a month are very different events, even though both count as one on the client-churn line.
Compare the two figures. When revenue churn is higher than client churn, larger clients are leaving, which is usually the more serious pattern. When it is lower, you are mostly losing smaller clients, which may be tolerable or even healthy if those accounts were unprofitable. Whichever way it goes, the gap tells you where to look.
Gross revenue retention takes the same idea and flips it into a positive. It shows how much of your starting income you kept, counting only cancellations and downgrades. It can never go above 100%, because it ignores growth. Net revenue retention then adds expansion from existing clients: extra services, higher retainers, price rises. It can go above 100%, which means your existing base is growing even if you add no new clients at all.
Be careful with NRR in a small agency. A single large upsell can lift it above 100% for a quarter and hide a lost client. Read GRR and NRR together: GRR shows the leak, NRR shows whether growth from existing clients covers it. If you want to go deeper on growing existing accounts, the guide to B2B account expansion covers it.
How to annualise churn and convert it into client lifetime
Teams often track churn monthly and then want an annual number for a plan or a forecast. Multiplying by twelve is tempting, but it overstates the result, because each month's losses come out of a smaller base. The correct approach compounds: annual churn equals one minus the monthly retention rate raised to the power of twelve.
For example, a monthly churn rate of 2% means monthly retention of 98%. Raise 0.98 to the power of 12 and you get about 0.785, so annual churn is about 21.5%, not 24%. At 3% a month, annual churn is about 30.6%. For a quarterly figure, use the power of four: 5% quarterly churn gives about 18.6% over a year.
Once you have an annual churn rate, you can estimate average client lifetime by dividing one by that rate. At 10% annual churn, the average lifetime is about 10 years. At 20% it is about 5 years. Treat this as an estimate, not a promise. It assumes churn stays steady, which it rarely does, and it works best as a way to compare scenarios: what would lifetime look like if churn fell by two points?
This connects to client value. Lifetime is one half of the usual customer lifetime value formula, so even small improvements in retention have an outsized effect on how much a client is worth over time. The free Retention and churn rate calculator includes annualised churn and average lifetime, so you can try the numbers without a spreadsheet.
Which to track: churn rate or retention rate?
The honest answer is both, with one as the headline. Use churn rate when the conversation is about problems: what went wrong, which clients left, what we can fix. Use retention rate when the conversation is about planning: how much of next year's income is already secure, how many new clients we need to win, what the base looks like.
Pick the view that suits the audience. Account managers tend to respond to churn, because it points to an action. Partners and finance leads often prefer retention, because it fits into a forecast. Whatever you choose, show the matching revenue number next to the client number, and say plainly which period and which clients are included.
Do not mix definitions. If last quarter's report counted every client and this quarter's counts only retainers, the trend line is meaningless. Write the definition on the first page of the report, and change it only on purpose, with a note.
| Situation | Better headline | Why |
|---|---|---|
| Reviewing why clients left | Churn rate | It points at the leak and invites questions about causes |
| Forecasting next year's income | Retention rate (revenue) | It shows how much recurring income you can plan on |
| Reporting to partners or a board | Retention rate, with churn beside it | It reads as a state of the business, and churn gives the detail |
| Checking if large clients are leaving | Revenue churn vs client churn | The gap shows whether the clients lost were bigger than average |
| Judging growth from existing clients | Net revenue retention | It counts expansion as well as losses |
- Choose the headline number for your team and keep it fixed for at least a year.
- Always show client count and revenue side by side.
- State the period, the group of clients and the definition of "lost" on every report.
- Compare against your own previous periods, not against someone else's average.
Churn rate for a small agency: small numbers and segments
Agencies work with far fewer clients than a subscription software company, and that changes how you read the rate. With eight clients, losing one is 12.5% churn. A single decision, perhaps a change of marketing director at the client, can move the number by more than a whole year of small improvements elsewhere. Do not panic over one data point and do not celebrate one either.
Three habits help. First, track a rolling 12 months rather than one quarter, so the line is smoother. Second, always read the numbers next to a short list of the clients who left and why, in a sentence each. Third, split the base into segments, such as client size, service line, account owner, sector or contract type, but only when each segment is large enough to mean something. A segment of three clients tells you about three clients, not about a pattern.
Segments are where churn becomes useful. You may find that clients on project work leave faster than clients on retainers, that one account manager has noticeably better retention, or that clients who never met the sponsor leave more often. Those are your own findings, and they are far more actionable than a generic average. Treat them as questions to investigate, though, rather than proof of cause.
Be consistent about what counts as lost. Common rules include a client that has cancelled, a client that has not been invoiced for 90 days, or a client that has moved to a much smaller scope. Write the rule down and apply it every time. A downgrade is not client churn, but it should show up in revenue churn.
A 30-minute monthly churn and retention routine
Numbers only help if they are looked at on a schedule. A monthly routine of about 30 minutes is enough for most small agencies. Do it on the same day each month, ideally before the monthly finance or partner meeting, so the figures feed straight into decisions.
Start with the data you already have: the client list with monthly recurring revenue, the start date, the status and the account owner. Update the status of each client, record any lost or downgraded accounts with a one-line reason, and calculate churn, retention, GRR and NRR for the month and for the rolling 12 months. Then move on to what matters more than the figures: the five accounts you are most worried about, and one action for each.
The template below is a plain text version you can paste into a document or a spreadsheet. The Retention and churn rate calculator does the arithmetic if you would rather enter the numbers in a form.
- Update the client list: status, monthly recurring revenue and owner.
- Record clients lost and downgrades, with a one-line reason for each.
- Calculate client churn, retention, GRR and NRR for the month and for the last 12 months.
- Compare the result with the same period last year and with the previous month.
- Name the five accounts that worry you most and write one action for each, with an owner and a date.
COPY & ADAPT
Monthly churn and retention review: [month]
Prepared by: [name]    Date: [date]

Starting clients (first day of the period): [number]
Clients lost: [number]    New clients (not counted in churn): [number]
Client churn rate: [lost ÷ starting]%    Client retention rate: [100 − churn]%

Starting monthly revenue: [amount]
Revenue lost to cancellations: [amount]    Revenue lost to downgrades: [amount]
Expansion revenue from existing clients: [amount]
Revenue churn: [lost ÷ starting]%    GRR: [%]    NRR: [%]

Rolling 12 months: client churn [%], GRR [%], NRR [%]

Clients lost or downgraded and why:
- [client]: [one-line reason]

Accounts to watch:
1. [client] - concern: [what] - action: [what], owner: [name], by: [date]

Definition used (period, client group, what counts as lost): [text]
Where churn and retention fit into B2B key account management
Key account management is the practice of giving your most important clients a named owner, a plan and a regular rhythm, instead of treating every relationship the same. In B2B account management, churn and retention are the scoreboard for that work. A key account manager can use them to see whether the investment in the biggest accounts is paying off, and to compare key accounts with the rest of the base.
The big idea is to calculate retention for key accounts separately. Your overall figure can look steady while the top ten clients, which carry most of the income, slip, or the other way round. Revenue churn and GRR on the key account group are the most useful numbers here, because one large departure is the biggest threat to the business. Strategic account management goes further and asks where those accounts could grow, which is where NRR comes in.
A key account plan gives the numbers a purpose. Each plan should state the revenue at stake, the renewal date, the people involved and the actions for the next quarter. The free Account plan generator on this site helps you write one in about 30 minutes. If you are building the wider approach from scratch, your account management strategy can begin with just this: a list of key accounts, an owner for each, and one retention number reviewed every month.
You do not need a large team to start. Choose your five or ten most valuable accounts, name one owner for each, track their revenue retention on its own line, and review it monthly using the routine above.
A simple account management system for agencies ↗
B2B account management plan template ↗
- Choose the clients that matter most by revenue or strategic value.
- Calculate client churn, GRR and NRR for that group separately from the rest of the base.
- Give each key account a named owner and a written key account plan.
- Review the key account retention line every month, and widen the approach as the habit settles.
Common churn and retention rate mistakes to avoid
Most errors with these numbers come from definitions, not from arithmetic. They are easy to make and easy to avoid once you know them.
The first is counting new clients in the base. If you divide losses by the closing client count, growth makes churn look smaller. Use the starting clients only. The second is mixing periods, such as comparing a monthly churn rate with an annual retention rate, or multiplying a monthly rate by twelve instead of compounding it.
Third, tracking only client count. A figure of 10% client churn tells you nothing about whether the clients lost were your biggest or your smallest. Always show revenue beside it. Fourth, treating a pause as a loss, or a loss as a pause. A client who says "we are pausing for a quarter" belongs in a note and in your watch list, and you should decide up front when a pause becomes churn.
Fifth, reading too much into one quarter when the base is small. Look at the rolling 12 months and the list of reasons. Sixth, using someone else's benchmark as a target. Your contract length, client size and services shape your numbers. Compare with yourself by segment.
Finally, collecting the numbers without acting on them. A churn figure is a prompt for a conversation. If a client has left, ask what you could have seen earlier. The same lesson applies to those still on your books: use the warning signs and a health score to find the next risk while there is still time to act.
Start with one account this week
- Write down the definition: period, client group, and what counts as lost.
- Use the clients active on day one of the period as the starting group.
- Calculate client churn as lost clients divided by starting clients.
- Calculate client retention as 100% minus churn, and check that the two add up.
- Do not count new clients in either number.
- Calculate revenue churn, gross revenue retention and net revenue retention on monthly recurring revenue.
- Compare client churn with revenue churn to see whether larger clients are leaving.
- Annualise monthly or quarterly rates by compounding, not by multiplying.
- Track a rolling 12 months and list the reason for each lost client.
- Calculate key accounts separately and review them monthly.
- Compare against your own past results by segment, not against other companies.
Common questions
What is the difference between churn rate and retention rate?
Churn rate is the share of clients you lost in a period. Retention rate is the share you kept. They use the same starting group and always add up to 100%, so a 10% churn rate means 90% retention. Churn highlights the leak, while retention shows how much you can plan on.
How do you calculate churn rate and retention rate?
Divide the clients you lost during the period by the clients you had at the start to get churn. Subtract churn from 100% to get retention. Do not count clients added during the period. For example, losing 2 of 20 clients is 10% churn and 90% retention.
Is a high retention rate always good?
Not always. A high client retention rate can hide a falling revenue retention rate if your biggest clients are shrinking or leaving. It can also include unprofitable clients you would be better off without. Check client count, revenue and margin together before you decide the number is healthy.
What is the difference between logo churn and revenue churn?
Logo churn counts clients lost, treating each as equal. Revenue churn counts the income lost from cancellations and downgrades. If revenue churn is higher than logo churn, larger clients are leaving. If it is lower, you are mostly losing smaller ones.
How do you turn monthly churn into annual churn?
Compound it. Annual churn equals one minus monthly retention raised to the power of twelve. A 2% monthly churn rate gives about 21.5% a year, not 24%, because each month's losses come from a smaller remaining base.
How does churn rate relate to key account management?
Key account management uses churn and retention as its scoreboard. A key account manager tracks revenue retention for the biggest accounts separately, because one lost key account can outweigh many small losses. Pair the numbers with a key account plan for each client.